More Features
Plotting Categories
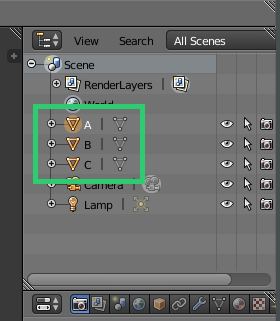
To plot data that is grouped into categories, you can use the -c flag and specify the name of the column to group the data points by. Each different category will be its own object in the resulting model. This will allow you to easily style the groups with different materials.
blendplot data.csv model.obj height weight cost -c category
Setting Number of Rows to Plot
If you have a particularly large dataset, but only want to plot some of the points then you can use the -r or --rows flags to specify how many rows you want to plot. When you use the flag and specify a number of rows n, then only the first n points in the dataset will be plotted.
For example, the following command will plot only the first 20 points in the dataset.
blendplot data.csv model.obj height weight cost --rows 20
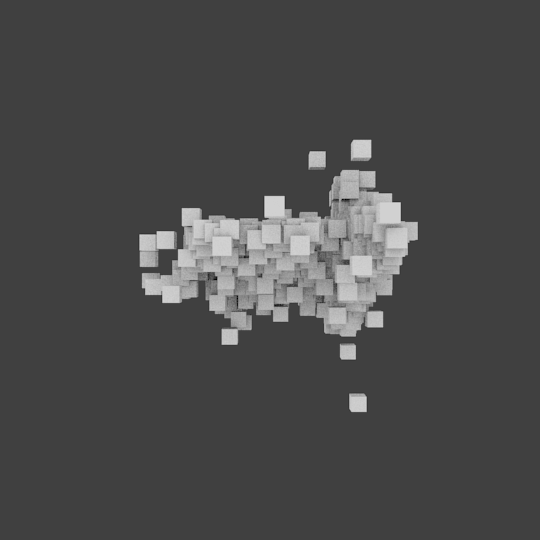
Changing the Point Size
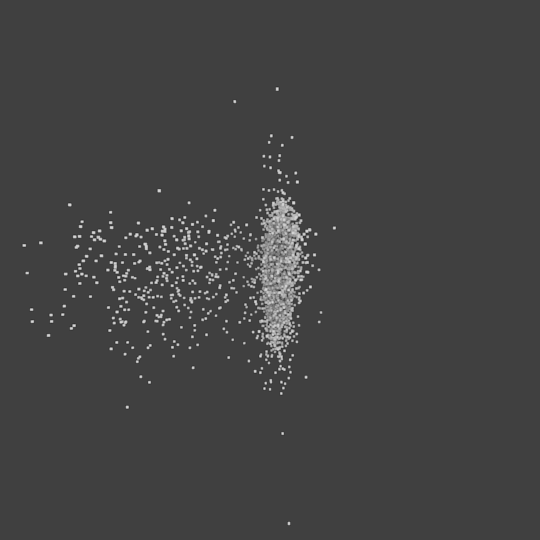
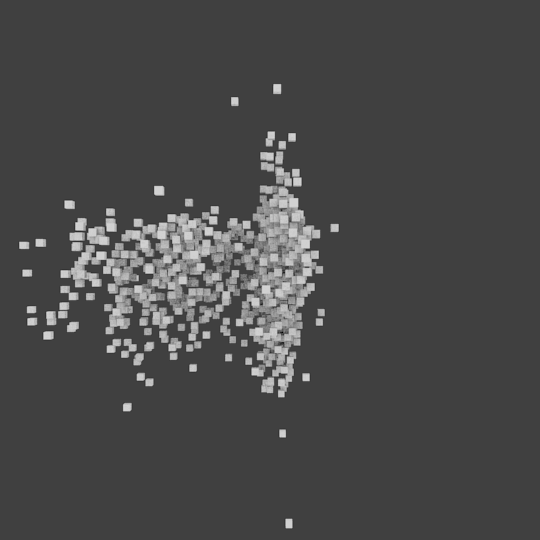
If you have data that is particularly dense or spread out and want to change the size of the cubes generated for each point, then you can use the --pointsize flag. When you use the flag and specify a point size, then all of the points will be of that size. The default point size is 0.0625.
For example, the following command will increase the size of the points to 0.2
blendplot data.csv model.obj height weight cost --point-size 0.2
| 0.0625 | 0.2 |
|
|
Changing the Spacing of the Points
If you want to change the spacing between the points, then there are two related flags that you can use to change it --scale-function and --spacing.
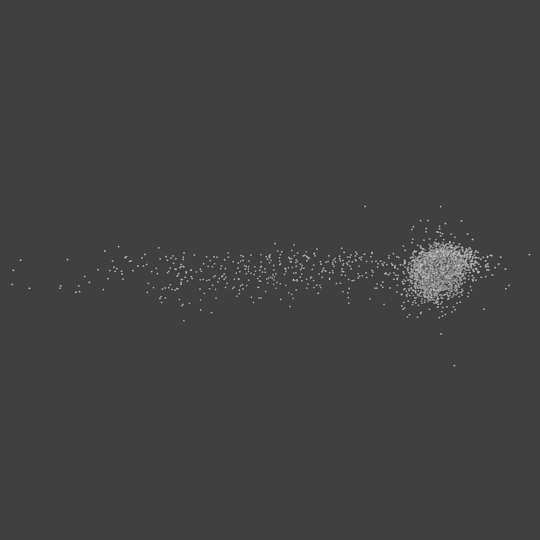
Scale Function
Blendplot applies a scaling function to the input data to get it tofit into a reasonable space and account for differences in the magnitude of different variables. By default, it uses the preprocessing.scale function from the sklearn library, however using the --scale-function flag it can be configured to use other scaling functions or no scaling function at all.
For example, the following command will plot the dataset using the normalize scaling function.
blendplot data.csv model.obj height weight cost --scale-function normalize
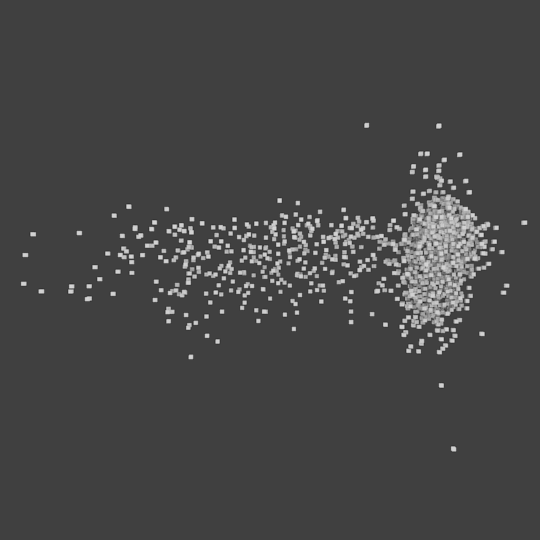
The following scaling functions are supported.
| maxabs_scale | minmax_scale |
|
|
| normalize | robust_scale |
|
|
| scale | none |

|
|
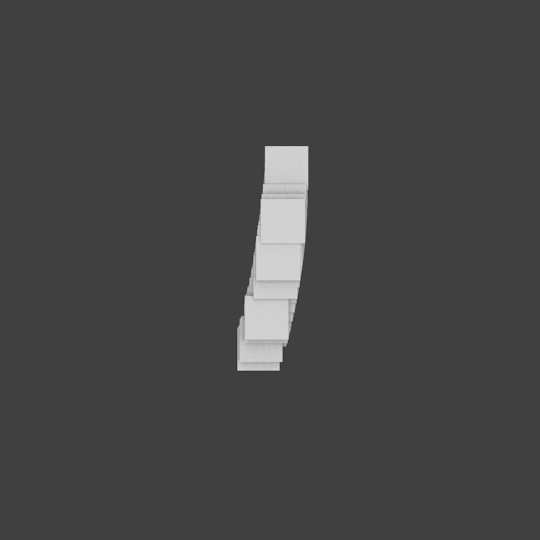
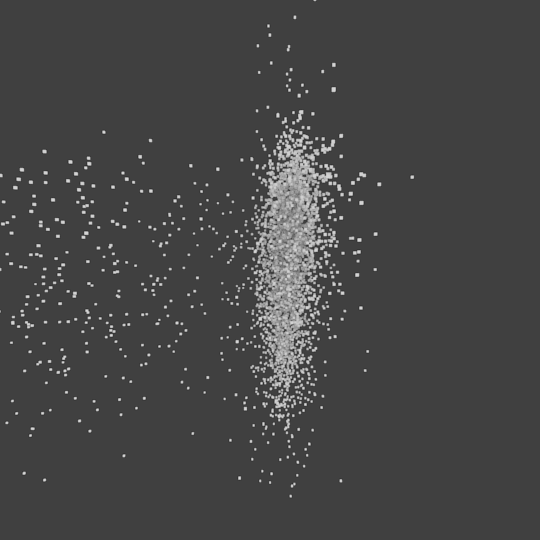
Spacing
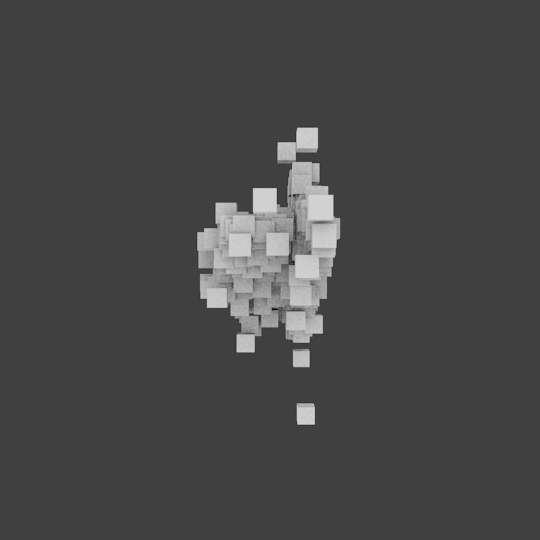
You can also change the point spacing by setting a spacing ratio using the --spacing flag. The (x,y,z) coordinates for each point are multiplied by the spacing ratio in order to control the spacing between data points. By default, a spacing ratio of 2.0 is used.
For example, the following command will plot the data with a larger spacing ratio of 4.0.
blendplot data.csv model.obj height weight cost --spacing 4.0
| 2.0 | 4.0 |

|
|